But here's the problem. The "average" engagement rate shifted again in 2025-2026, and it now varies wildly by content format, page size, and industry. A number that looks strong for a 5,000-follower SaaS page could be mediocre for an enterprise financial services brand.
This article breaks down the real 2026 benchmarks, by format, size, and industry, plus how to calculate your own rate accurately and actually improve it.
Key Takeaways
- A "good" LinkedIn engagement rate in 2026 is 3-6%, though it varies by format, size, and industry
- Native documents and carousels outperform text and link posts
- Smaller pages typically show higher engagement rates than enterprise accounts, despite lower total reach
- Always measure engagement against impressions, not followers, for an accurate read
- Benchmarks only matter when compared against similar audience size, industry, and content type
What Is LinkedIn Engagement Rate and What Drives It
Engagement rate is calculated as total engagements divided by total impressions, multiplied by 100. Engagements include reactions, comments, shares, clicks, and new follows generated by a post.
This number does double duty. It works as a content-quality signal, showing whether your audience actually cares about what you're posting, and as an algorithmic input, since LinkedIn pushes higher-engagement posts to a larger share of your audience before extending reach further.
Two levels matter here, and they're not the same thing: post-level engagement rate reflects how one specific update performed, while page-level engagement rate reflects your account's overall health across weeks or months.
Tracking only post-level numbers can mislead you. One viral post can mask a pattern of underperforming content underneath it.
Factors That Influence Your Real-World Engagement Rate
Published averages rarely match what an individual page experiences. That's because several variables swing results in either direction:
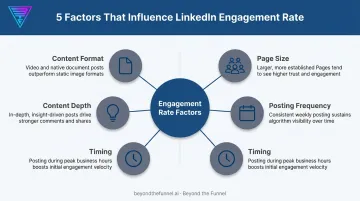
- Content format: the single biggest factor; documents and carousels consistently beat text and links
- Page size: smaller, niche audiences tend to engage at higher rates than large, diversified ones
- Posting frequency: both over-posting and under-posting suppress reach
- Timing: professional audiences engage most during weekday work hours
- Content depth: original data and genuine thought leadership outperform generic company updates
LinkedIn Engagement Rate Benchmarks for 2026
LinkedIn's overall average engagement rate sits at 5.20% in 2026, up 8% year-over-year, according to Socialinsider's analysis of 1.3 million posts across more than 16,000 business pages. Other trackers, including Hootsuite, report a lower company-page average closer to 3.4%.
The gap comes down to methodology, not conflicting data. Socialinsider measures engagement against impressions (how many people actually saw the post), while Hootsuite measures it against followers (your total audience, whether they saw the content or not).
Since LinkedIn doesn't show every post to every follower, per-impression benchmarking gives you a more reliable read on actual content performance.
Benchmarks by Content Format
Format is the biggest lever you control. Here's how 2026 Company Page averages break down by post type:
| Format | Engagement Rate | Trend |
|---|---|---|
| Native document | 6.6-7.0% | Top performer, 2 years running |
| Multi-image/carousel | 6.4-6.9% | Highest impressions and likes |
| Video | 5.6-6.0% | Views down ~36% YoY, engagement up |
| Image | ~5.3% | Rising steadily |
| Text | ~4.5% | Improving but mid-pack |
| Poll | ~4.2% | Slight decline |
| Link | 3.3-3.9% | Consistently weakest |
Notice the video anomaly: engagement rate climbed even as raw views dropped. Fewer people are clicking play, but the ones who do are interacting more. Quality over volume.
Benchmarks by Company/Page Size
Smaller pages generally see stronger percentage engagement because their audiences are more niche and invested. Larger enterprise pages trade that percentage for sheer reach and lead volume.
Follower growth follows the same pattern:
| Follower Range | Annual Growth Rate |
|---|---|
| 1K-5K | 24.5% |
| 5K-10K | 31.0% |
| 10K-50K | 21.3% |
| 50K-100K | 16.25% |
| 100K-1M | 6.4% |
The takeaway: don't panic if your 8,000-follower page grows faster and engages harder than a competitor's 200,000-follower page. That's the expected pattern, not a fluke.
Benchmarks by Industry
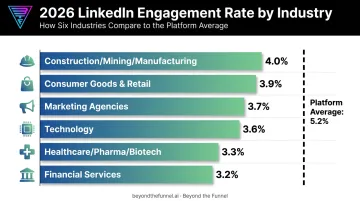
Some industries simply perform better on LinkedIn than others. Per Hootsuite's 2026 industry data:
- Construction, Mining & Manufacturing — ~4.0%
- Consumer Goods & Retail — ~3.9%
- Marketing Agencies — ~3.7%
- Technology — ~3.6%
- Healthcare, Pharma & Biotech — ~3.3%
- Financial Services — ~3.2%
Technology, financial services, and healthcare all land above the platform average, which is good news if your brand sits in any of Beyond the Funnel's core client industries. Media & entertainment (2.0%) and education (2.8%) tend to underperform on LinkedIn compared with other channels, likely because those industries lean more consumer-facing by nature.
How to Calculate and Track Your LinkedIn Engagement Rate
The formula stays consistent regardless of page size or industry:
(Total Engagements ÷ Total Impressions) × 100
Impressions, not followers, should always sit in the denominator, and here's why that distinction matters in practice:
Say a post earns 500 engagements from 10,000 impressions, which works out to a 5.0% engagement rate. Now run those same 500 engagements against a follower count of 25,000, and the rate suddenly drops to 2.0%. Same post, same performance, wildly different-looking result depending on which number you divide by.
To track this properly:
- Pull post-level and page-level engagement rate monthly, not after every single post
- Compare month-over-month trends rather than reacting to one outlier
- Use LinkedIn's native Page Analytics, which reports this data directly under Content analytics
Reacting to a single low-performing post is a common mistake, since one slow Tuesday doesn't mean your strategy failed.
Are You Above or Below Benchmark? Common Interpretation Mistakes
Published averages get misused constantly. Before you compare your numbers, watch for these traps:
- Treating averages as hard targets — a 5.2% platform average means nothing if your industry typically sits at 3.2%; context sets the real bar
- Comparing against followers instead of impressions: this skews your real performance on larger pages, since not every follower sees every post
- Chasing reach while ignoring engagement quality, since a comment from a decision-maker carries more weight than ten passive likes from unrelated accounts
- Assuming underperformance means "LinkedIn doesn't work for B2B": often that's just a fixable format problem, like leaning too heavily on text or link posts
Most engagement rate disappointments trace back to one of these four issues, not a broken strategy.
How to Improve Your LinkedIn Engagement Rate in 2026
Once you know where you stand, here's what actually moves the number:
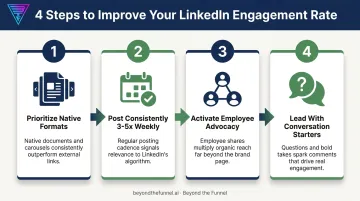
- Prioritize native formats: shift your content mix toward documents, carousels, and native video; these outperform text and link posts across nearly every 2026 benchmark
- Post consistently: aim for 3-5 times per week for company pages; both stagnation and audience fatigue suppress reach
- Activate employee and leadership advocacy: personal profile shares tend to generate stronger engagement than company-page posts alone
- Lead with conversation-starters: questions, polls, and stated opinions invite comments, and comments carry more algorithmic weight than likes
Strong organic engagement tells you something valuable: which audiences actually respond to your message. But engagement alone doesn't build pipeline.
That's where turning organic signal into paid strategy matters. Beyond the Funnel, led by Joshua Stout, one of only 16 LinkedIn Certified Marketing Experts in the U.S., helps B2B brands validate which audiences are worth scaling. The agency then builds a full-funnel LinkedIn ad strategy around what's already working organically, rather than starting from a guess.
Frequently Asked Questions
What is a good engagement rate for LinkedIn?
Generally, 3-5% counts as strong for company pages, while top formats like native documents can reach 6-7%. Context, including industry, format, and audience size, always matters more than one benchmark number.
How is LinkedIn engagement rate calculated?
The formula is (total engagements ÷ total impressions) × 100. LinkedIn uses impressions, not followers, as the standard denominator for accurate measurement.
What is the average LinkedIn engagement rate in 2026?
LinkedIn's overall average sits around 5.20% when calculated per impression, though company-page averages calculated against followers often land closer to 3-3.5%.
Which LinkedIn content format has the highest engagement rate?
Native document posts and multi-image carousels consistently lead, each averaging above 6% engagement rate in 2026 benchmark data.
Does company size affect LinkedIn engagement rate?
Yes. Smaller, niche pages typically see higher percentage engagement than large enterprise pages, which instead benefit from greater absolute reach and lead volume.
How can I improve my LinkedIn engagement rate?
Prioritize native formats, post consistently, activate employee advocacy, and create content that invites comments rather than passive likes.