Introduction
You open Campaign Manager, and there it is: a wall of numbers. Impressions, CTR, CPM, CPC, conversion rate, spend, results — all fighting for your attention at once.
Most B2B marketers stare at that dashboard without knowing which numbers actually predict pipeline. They fixate on clicks because clicks feel good, then wonder why the CFO isn't impressed at the next budget review.
Reading a dashboard is a skill: knowing where to look, what to compare a number against, and how to catch a problem before it drains your budget for three weeks straight.
This guide breaks down the LinkedIn Campaign Manager dashboard section by section: where the data lives, which metrics matter at each funnel stage, and how to interpret what you're seeing the way a LinkedIn Certified Marketing Expert would.
Key Takeaways
- Campaign Manager's Breakdown, Compare, and Insights tabs hold answers most advertisers never find
- Read every metric by funnel stage, not in isolation from the campaign's actual objective
- A number means nothing without a benchmark: your own history, industry data, or account goals
- Most "bad performance" panics trace back to a wrong date range or mismatched attribution window
- Reading the dashboard is step one; growth comes from turning that insight into a testing cycle
Navigating the LinkedIn Campaign Manager Dashboard
Before you can interpret a single metric, you need to know where each data view actually lives inside Campaign Manager. Get this part wrong, and every number downstream is misleading.
Getting Oriented: Access and Setup
You need at least Viewer-level permission inside Business Manager to see reporting data — though Viewers can't create or edit campaigns themselves. Billing Admins, Account Managers, Campaign Managers, and Creative Managers all get full reporting access along with editing rights.
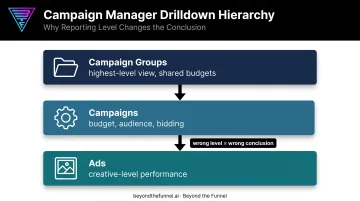
Once you're in, Campaign Manager gives you three drilldown levels, and each one tells a different story:
- Campaign Groups — the highest-level view, best for comparing related campaigns and shared budgets
- Campaigns — where budget, audience, and bidding decisions actually live
- Ads — the creative-level view, best for isolating which specific asset is driving (or killing) performance
Pick the wrong level and you'll draw the wrong conclusion. A campaign group might look fine in aggregate while one campaign inside it is quietly burning spend.
Time range matters more than most advertisers realize. Campaign Manager offers presets such as Last 90 days, Last month, Last quarter, and All time, plus fully custom date ranges. An inconsistent date range is the single most common reason two people looking at "the same campaign" see completely different numbers.
Using Breakdown and Compare for Deeper Reads
The default table view hides most of the interesting data. The Breakdown dropdown unlocks it:
- Conversions — separates results by conversion type instead of lumping them together
- On/Off Network — splits delivery between LinkedIn itself and LinkedIn Audience Network publishers
- Placement — for video, separates Feed, standalone Audience Network, and in-stream delivery
- Device Type — reveals whether mobile users behave differently than desktop
- Carousel — shows which individual card in a carousel ad is pulling its weight
The Compare feature adds another layer. Stack Previous period, Last month, Last quarter, or a custom timeframe against current results—with percentage change plus Industry or Self benchmarking built in.
Here's the part people get wrong: those green and red indicators are directional signals, not verdicts. Red doesn't mean "failure." It means "look closer."
Two views most advertisers never open:
- Companies Hub (Plan → Companies) — centralizes company-level engagement and revenue data, built for account-based prioritization
- Measurement Insights (Measurement → Insights) — a full-funnel, account-wide view tying ad activity to actual business impact
Custom column views are tied to the user who created them, capped at 10 per person. If you and a teammate are staring at different numbers on the same campaign, this is often why.
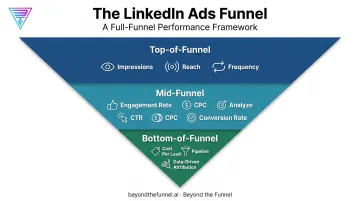
The Metrics That Matter: Reading KPIs by Funnel Stage
Vanity metrics in isolation tell you almost nothing. A 2% CTR is either great or terrible depending on what stage of the funnel that ad sits in, and what it was built to do.
Top-of-Funnel: Reach and Attention Metrics
Impressions and Reach tell you how far your message traveled. Frequency tells you whether the same people are seeing it too many times. When frequency creeps up while CTR drops, that's ad fatigue setting in. Refresh the creative before spend keeps flowing into an audience that's tuned out.
Read CTR and CPM together, never separately. A high CPM paired with a low CTR usually signals an audience or creative mismatch, not just an expensive auction.
For context, cross-industry LinkedIn campaigns see a median CTR of 0.52% across more than 150,000 campaigns, with Finance and Insurance running slightly higher at 0.56%.
Mid-Funnel: Engagement and Lead Metrics
Engagement Rate (reactions, comments, shares) signals whether your message resonates, separate from whether people click through. A high engagement rate with a low CTR often means the content is interesting but the offer isn't compelling enough to act on.
CPC, Conversion Rate, and Cost Per Lead diagnose where the real problem sits:
- High CPC, decent conversion rate → the ad works, the auction is just competitive
- Low CPC, poor conversion rate → the click is cheap, but the landing page isn't closing the deal
- High CPC and poor conversion rate → both the ad and the post-click experience need work
B2B SaaS advertisers should expect CPC to run notably higher than cross-industry averages. One analysis of 70+ B2B SaaS companies and $28M in LinkedIn spend found average CPC climbing from $10.48 in Q1 to $15.72 by Q3. Benchmarks shift by quarter, not just by industry.
Bottom-of-Funnel: Pipeline and Revenue Metrics
Pipeline and Attribution Model metrics only populate once a CRM is connected through Business Manager. Skip this step and you're managing LinkedIn ads blind to what happens after the lead form gets submitted. This is the single highest-leverage setup step for any B2B advertiser.
Once connected, look at Leads (data-driven attribution) alongside standard leads. Standard reporting gives last-click credit only. Data-driven attribution uses a 180-day lookback to show every campaign that contributed along the way, which usually paints a very different picture of what's actually working.
Interpreting Your Results: What's Normal, What's a Flag, and What's Broken
Misreading a metric has real consequences: pausing a campaign that's actually working, or scaling one that's quietly losing money. Getting this interpretation right matters as much as the setup itself.
Normal / Acceptable Your CTR sits near or above your account's self-benchmark, CPM stays consistent with recent history, and CPC falls within the range your industry typically sees (roughly $2.59 to $8.04 depending on vertical, per AgencyAnalytics' 2025 benchmark data).
Next step: maintain the current setup and start planning your next scale test.
Minor Issues CTR is trending slightly down period-over-period, or frequency is creeping toward the higher end of its usual range for your account. These deserve monitoring, not panic.
Next step: keep watching, and queue up a creative refresh before it becomes a real problem.
Out-of-Spec
- Frequency far above your account's typical range with performance dropping alongside it
- CTR sitting well below your own self-benchmark, not just the industry median
- High impression volume paired with near-zero engagement
Next step: pause, refresh creative, or narrow the audience immediately.
Benchmarks shift significantly by industry, objective, and even by quarter. A number that looks alarming in isolation might be completely normal for your account's history. Context from someone who's read hundreds of these dashboards often matters more than the raw figure.
Common Mistakes That Lead to Misreading Your Dashboard
Most "bad performance" scares are actually misreads. The usual suspects:
- Mismatched comparisons: comparing a Brand Awareness campaign's CTR to a Lead Gen campaign's, or this month's numbers to a different date range
- Vanity metric fixation: chasing impressions and clicks while ignoring Cost Per Lead and pipeline impact
- Misreading Compare's color coding: treating a red indicator as a failed campaign instead of a cue to open the breakdown
- Skipping CRM connection: judging Pipeline and Attribution metrics with no CRM connected, then concluding a campaign "generated no revenue" when the data wasn't flowing yet
Each of these is fixable in minutes. None require pausing a campaign that's doing its job.
From Reading to Results: Turning Dashboard Insight Into Strategy
Reading your metrics correctly only matters if it leads somewhere. Every anomaly you spot should become a hypothesis to test, not just an observation you note and move past.
Here's the limit of dashboard reading alone: even a perfectly accurate read can't tell you why an audience isn't responding. That requires cross-referencing creative, messaging, and offer against each other, which is where experience starts to outweigh raw data literacy.
This is the gap Beyond the Funnel was built to close. Founded by Joshua Stout, one of 80 LinkedIn Certified Marketing Experts worldwide, the agency has managed and optimized more than 1,000 LinkedIn ad accounts across SaaS, finance, technology, and healthcare.
That volume revealed a pattern: most underperforming campaigns don't have a creative or budget problem. They have a structural problem that dashboard numbers alone won't reveal.
Beyond the Funnel's full-funnel testing framework connects awareness, consideration, and conversion into one measurable system:
- Validates audiences before scaling
- Refines messaging through continuous creative testing
- Turns dashboard reads into a repeatable growth engine, not one-off fixes
One client, Evidation, grew from a few dozen sales opportunities to over 100 in a single year working this way.
Reading the dashboard is step one. Turning it into predictable pipeline is the actual job.
Frequently Asked Questions
How do I use the LinkedIn Ads dashboard to view and manage my ads?
The Advertise tab in Campaign Manager is your main dashboard. Switch between the Campaigns, Ad Sets, and Ads tabs, then apply filters and customize columns. Use the Breakdown and Compare menus to monitor performance and manage campaigns.
What is a good CTR for LinkedIn Ads?
There's no single universal number. CTR varies by industry and objective. Compare your CTR against your own historical benchmarks and industry benchmark data inside Campaign Manager rather than chasing a generic target.
How often should I check my LinkedIn Ads dashboard?
A few times weekly works well for active, recently-launched campaigns; monthly is enough for budget and trend review on stable ones. Checking too often early on tends to trigger premature optimization before data has time to stabilize.
What's the difference between LinkedIn's Performance tab and Measurement Insights page?
The Performance tab shows tactical, ad-set-level metrics for day-to-day management. Measurement Insights provides a full-funnel, account-wide view of business impact across every ad set.
Can I connect LinkedIn Ads data to my CRM within Campaign Manager?
Yes, through CRM Sync in Business Manager. Once connected, it unlocks Pipeline and revenue metrics directly inside your reporting dashboard, including data-driven attribution leads with a 180-day lookback.
Why do my LinkedIn Ads metrics look different in Campaign Manager vs. exported reports?
Certain columns, including MRC-accredited metrics and data-driven attribution leads, aren't available in CSV exports even though they appear live in the dashboard. That export gap is usually what causes the mismatch.