Most B2B marketers ask this question weekly, and most don't have a real answer. LinkedIn ad costs keep climbing, and performance swings wildly depending on your industry, your offer, and even your buyer's job title. This breakdown draws on insights from Joshua Stout, one of 80 LinkedIn Certified Marketing Experts worldwide, who has managed and optimized over 1,000 LinkedIn ad accounts.
Here's what's ahead: an industry-by-industry look at LinkedIn benchmarks, the reasons behind the gaps, how ad format changes your numbers entirely, and how to turn all of this into an actual optimization plan instead of a source of anxiety.
Key Takeaways
- Benchmark gaps trace back to contract value, buyer intent, and sales cycle length.
- SaaS and healthcare brands pay more per click than finance or education.
- Campaign objective can swing your CPC more dramatically than industry alone.
- Treat benchmarks as a compass. Your own account history is the real scorecard.
Why LinkedIn Ad Benchmarks Matter for B2B Marketers
LinkedIn isn't just another line item in the media plan. For B2B advertisers, it's often the primary one.
LinkedIn was forecast to capture 47.2% of US B2B display ad spending and 22.9% of US B2B digital ad spending in 2024, according to eMarketer's October 2024 forecast. No other platform gets close to that share for reaching senior decision-makers.
That dominance is why benchmarks matter. Marketers typically track two kinds:
- Internal benchmarking: comparing this month's CTR, CPC, or CPL against your own account's history.
- External benchmarking: comparing your numbers against industry or platform-wide averages.
Relying only on external benchmarks is risky. A global average CPC blends high-ACV SaaS deals with $200 course sign-ups, so it tells you almost nothing about what your campaign should cost.
Spend intensity varies by industry, too. Technology and SaaS companies, professional and business services firms, and finance brands run the heaviest LinkedIn ad presence—their buyers already research on the platform, so paid visibility commands a premium. Industry-specific benchmarks help you judge results against peers in similar auctions, not a diluted global average.
LinkedIn Ads Benchmark Breakdown by Industry
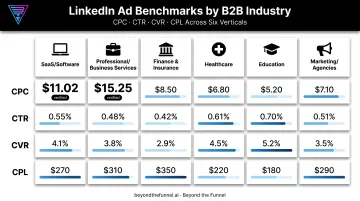
CTR, CPC, conversion rate (CVR), and CPL all shift meaningfully by sector. Use this as a directional reference, not a promise. Your targeting precision and offer strength will move these numbers more than your industry label ever will.
SaaS/Software
SaaS advertisers face the most competitive auction on LinkedIn. A 2026 analysis of over $700,000 in LinkedIn ad spend, primarily SaaS accounts, found an average CPC of $11.02, according to Search Engine Land's LinkedIn CPC benchmark study.
High average contract values, intense competitive bidding, and long sales cycles all push costs up.
Finance & Insurance
Finance brands generally see stronger conversion rates once a click happens. High-trust, high-intent audiences convert more readily than colder segments, which helps offset moderate-to-elevated click costs.
Healthcare
Healthcare buying committees are compliance-heavy and slow-moving, and niche targeting (think hospital administrators or clinical decision-makers) shrinks the available audience. Both factors tend to push CPC and CPL higher than the B2B average.
Education, Marketing/Agencies, and Business Services
The same analysis found an average CPC of $15.25 for professional and business services, even higher than SaaS in that dataset. Marketing and agency advertisers usually land in a moderate cost band, where offer clarity matters more than category averages.
Education brands often see lower costs overall. Lower-value offers (like course enrollments) rarely need to win every auction against enterprise budgets.
| Industry | CPC (verified where noted) | Relative CTR | Relative CVR | Relative CPL |
|---|---|---|---|---|
| SaaS/Software | ~$11.02 avg* | Moderate | Moderate | High |
| Professional/Business Services | ~$15.25 avg* | Moderate | Moderate-Strong | High |
| Finance & Insurance | Moderate | Strong | Strong | Moderate |
| Healthcare | Elevated | Lower | Lower | Elevated |
| Education | Lower | Higher | Moderate | Lower |
| Marketing/Agencies | Moderate | Moderate | Moderate | Moderate |
*Verified figures from Search Engine Land's 2026 analysis. All other cells reflect directional patterns based on ACV, sales cycle, and buying-committee size, not exact published figures.
Why Do Benchmarks Vary So Much Between Industries?
Five forces explain most of the gap between sectors:
- Average contract value (ACV) sets your ceiling. A $50,000 SaaS deal justifies a different CPL than a $500 course sign-up—higher-ACV advertisers can outbid others for the same audience and still hit return targets.
- Sales cycle length and buying-committee size slow conversion even when interest is real. Healthcare and finance often add multiple stakeholders and compliance checkpoints.
- Audience seniority and competition raise costs. Senior titles usually carry a premium over broader IC audiences because LinkedIn auction prices climb with smaller pools, tighter targeting, and heavier competition.
- Industry-specific saturation pushes CPL up faster. When every SaaS competitor hits the same VP of Marketing audience with similar creative, costs climb and creative fatigue sets in sooner.
- Regional differences sit on top of all of this. North America, EMEA, and APAC each have their own competitive dynamics, so a "global average" often hides real swings underneath.
How Ad Format Choice Changes Your Benchmarks
Industry isn't even the biggest lever here. Campaign objective and ad format often matter more. The same 2026 analysis found CPC ranging from $4.45 for engagement campaigns to $71.43 for video-view campaigns, with a $11.12 blended average CPC across all objectives:
| Campaign Objective | Average CPC |
|---|---|
| Engagement | $4.45 |
| Website conversions | $4.84 |
| Website visits | $6.75 |
| Brand awareness | $8.34 |
| Lead generation | $31.29 |
| Video views | $71.43 |
Lead generation campaigns cost nearly seven times more per click than engagement campaigns. That isn't a red flag. It typically reflects the stronger conversion intent tied to that objective.
Format choice shifts the picture further:
- Lead Gen Forms generally convert better than external landing pages because prospects never leave LinkedIn or wait for a page to load.
- Message and Conversation Ads run on different metrics (open rate, in-message CTR), so stacking them against Sponsored Content benchmarks mixes incompatible data.
- Video and Text Ads typically serve upper-funnel awareness goals. Judging them against lead-gen CPL benchmarks misreads their purpose entirely.
How to Use These Benchmarks to Improve Your LinkedIn Ad Performance
Benchmarks are only useful if you turn them into action. Here's the sequence Beyond the Funnel walks clients through.
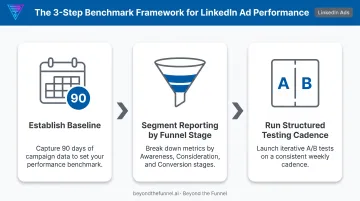
- Establish your own baseline first. Pull 90 days of your account's CTR, CPC, and CPL before you compare anything against an industry average. Your history predicts your future far better than a global number does.
- Segment reporting by funnel stage. Track CTR for awareness campaigns, CPL and CVR for lead-gen campaigns. Chasing every metric equally just creates noise.
- Run a structured testing cadence. Rotate audience, creative, and offer variations systematically instead of changing everything at once. This is how you close the gap between where you sit today and top-quartile performance.
Beating or missing a benchmark isn't inherently good or bad. Factor in your ACV, your funnel stage, and lead quality before drawing conclusions. A high CPL tied to enterprise-grade leads can still be a great result.
This is the gap Beyond the Funnel was built to close. Founder Joshua Stout is one of just 16 LinkedIn Certified Marketing Experts in the U.S. His testing framework, built across more than 1,000 managed accounts in SaaS, finance, technology, and healthcare, helps brands move past guesswork.
One client, Evidation, grew its pipeline from a few dozen opportunities to over 100 in a single year. Benchmarks alone don't produce that result. Validated audiences and continuous creative testing do.
Frequently Asked Questions
What are the performance benchmarks for LinkedIn ads?
Blended CPC across LinkedIn campaigns recently averaged around $11, though it ranges from roughly $4.45 for engagement objectives to over $70 for video views. CTR and CPL shift too much by industry and format to quote one reliable global number.
What industry uses LinkedIn the most?
Technology and SaaS companies, professional and business services firms, and finance brands maintain the heaviest LinkedIn ad presence. Their buyers actively research and network on the platform, so paid visibility there carries real weight.
What is a good CTR for LinkedIn ads?
Most practitioners treat a CTR near or above 0.5% as competitive for Sponsored Content. If yours consistently trends below 0.3%, it's usually a sign to revisit your targeting or creative.
How much should I expect to pay per lead (CPL) on LinkedIn?
CPL varies enormously by offer type, industry, and audience quality. A gated whitepaper and an enterprise demo request will never cost the same, so use your own historical CPL as the benchmark that actually matters.
Why are LinkedIn ad costs higher than other platforms like Meta or Google?
The premium reflects access to verified professional and decision-maker targeting that isn't available elsewhere. You're paying for audience precision, not just impressions.
How often should I benchmark my LinkedIn ad performance?
Review quarterly at minimum, since that's typically enough time to gather statistically meaningful data. During active testing phases or major campaign changes, check weekly or biweekly instead.