Introduction
Most B2B marketers know the drill: log into Campaign Manager, check impressions, glance at clicks, close the tab. The numbers move, but nobody in the boardroom asks about impressions. They ask about pipeline.
That's the gap. Native LinkedIn reporting shows you what happened on the platform, but it rarely connects to what actually matters: revenue and ROI.
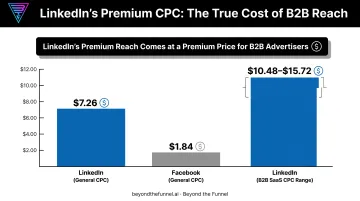
According to Metadata's 2024 paid social benchmark report, LinkedIn's cost-per-click runs as high as $7.26, compared to $1.84 on Facebook. Guessing your way through analysis gets expensive fast.
This guide breaks down the exact metrics, tools, and step-by-step framework you need to stop watching numbers and start making decisions with them.
Key Takeaways
- Match metrics to funnel stage before judging any campaign's performance
- Native Campaign Manager works for basic tracking but stops short of revenue attribution
- Repeatable analysis frameworks beat reactive, day-to-day number-watching
- CRM integration is the only reliable way to prove LinkedIn's true ROI
What Is LinkedIn Ads Reporting & Analytics?
Reporting and analytics get used interchangeably, but they're not the same thing.
Reporting is the collection and display of raw data: impressions, clicks, spend, and audience reach. Analytics is what you do with that data: interpreting trends, spotting patterns, and deciding where budget goes next.
Campaign Manager, LinkedIn's native tool, handles the reporting side reasonably well. Out of the box, it gives you:
- Impressions, clicks, and spend at the campaign and creative level
- Professional demographic breakdowns by job title, seniority, industry, and company size
- Performance charts and a demographics view for quick visual checks
The catch is that these professional demographic metrics can lag 12 to 24 hours behind real-time performance data, which matters if you're making same-day budget calls.
Why B2B Advertisers Need More Than the Basics
LinkedIn's targeting precision comes at a premium. B2B SaaS companies analyzed in a 2025 study spent between $10.48 and $15.72 per click across a $28 million ad spend dataset, according to HockeyStack's LinkedIn Ads Benchmark Report. That's a higher cost than most social platforms.
When you're paying that much per click, "impressions look fine" isn't a strategy. You need analytics that connect spend to leads, and leads to closed revenue—otherwise high CPC spend stays disconnected from pipeline.
Key LinkedIn Ads Metrics to Track for Meaningful Insights
Not every metric deserves your attention every week. The right ones depend entirely on what stage of the funnel your campaign is targeting. A brand awareness push and a demand-gen campaign should never be judged by the same yardstick.
Awareness & Engagement Metrics
These tell you whether your ad is getting seen and noticed, not whether it's converting.
- Impressions and Reach: Impressions count total ad views; reach counts unique people who saw it. High impressions with low engagement usually means you're hitting the same tired audience.
- Click-Through Rate (CTR): CTR = Clicks ÷ Impressions. In a 2025 dataset, carousels averaged 0.49%, single-image 0.39%, and video 0.20% (Huble). Use these as reference points, not pass/fail thresholds.
- Average Dwell Time and Social Actions: Time spent on a post and organic likes, comments, or shares reveal whether your content actually resonates, beyond a passive click.
Lead & Conversion Metrics
This is where reporting starts connecting to pipeline.
- Conversions and Conversion Rate: LinkedIn's default window is 30 days post-click and 7 days view-through, last-touch by campaign. A valid conversion depends on the event you defined: form fill, demo request, or download.
- Cost Per Lead (CPL): CPL = Total Spend ÷ Number of Leads. Use it to forecast how much pipeline you can buy with a given budget.
- Cost Per Conversion: Same math, different denominator: cost against your defined conversion event, not just raw leads. It feeds directly into CAC, which matters more to a CFO than CPL.
Cost & Efficiency Metrics
These determine whether your budget is being spent efficiently or leaking value.
| Metric | Formula | What It Tells You |
|---|---|---|
| CPC | Total Spend ÷ Clicks | Efficiency of your bidding strategy |
| CPM | (Total Spend ÷ Impressions) × 1,000 | Cost of visibility at scale |
| ROAS | Revenue Generated ÷ Cost of Advertising | The number stakeholders actually care about |
Frequency and audience penetration round this out. LinkedIn's 2025 frequency-capping feature lets eligible brand-awareness campaigns limit delivery to 3 to 30 impressions per seven days, per PPC Land.
That's a control setting, not a fatigue diagnosis. Use it when CTR slides while frequency climbs.
How to Access Your LinkedIn Ads Data: Native Reporting vs. Advanced Tools
You can access LinkedIn Ads data three ways: native Campaign Manager, third-party BI dashboards, or CRM integration. Each path trades setup effort for deeper insight.
Native Campaign Manager
Campaign Manager is free to use and covers the essentials: the Campaign Performance tab, Performance Chart, and Demographics view. It's a solid starting point.
Its limits show up fast, though:
- No native revenue attribution unless connected to a CRM
- Limited sharing options for stakeholders outside the ad account
- Minimal customization for cross-campaign or cross-channel comparison
- API caps at 15,000 elements and 20 metrics per request when pulling large datasets
Third-Party Dashboards and BI Tools
Neither Microsoft Power BI nor Google Looker Studio offers a native LinkedIn Ads connector. Both rely on third-party community connectors such as CData for Power BI or Porter for Looker Studio to pull LinkedIn data into automated, shareable dashboards.
This matters because it means "connecting LinkedIn to Looker Studio" isn't a five-minute native integration. Budget time for setup, or work with a partner who's already built the pipeline.
CRM Integration
Syncing LinkedIn engagement data with your CRM is the only way to see which campaigns actually influence pipeline and closed revenue, not just clicks.
LinkedIn's Conversions API creates a direct server-to-LinkedIn connection with official support for Salesforce, HubSpot, and Dynamics 365. Connected accounts can expose CRM leads, pipeline value, and attributed revenue at the campaign level.
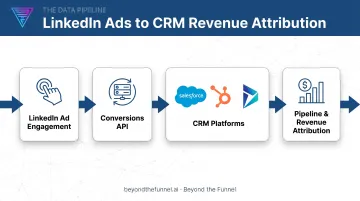
Without this step, you're stuck comparing clicks across campaigns and hoping the cheapest one is also the best one. It rarely is.
A Step-by-Step Framework to Analyze LinkedIn Ads Performance
Watching numbers isn't analysis. Here's a repeatable process:
- Start with your objective. Match your key metrics to your funnel stage before evaluating a single number. Judging an awareness campaign by CPL is like grading a marathon runner on sprint speed.
- Establish a baseline. Use your first few weeks of live data as your comparison point. Without a baseline, every future number is just floating in space.
- Analyze trends over time. Compare weekly and monthly performance rather than reacting to daily blips. A single bad day rarely means creative decay; a three-week downward trend usually does.
- Segment by audience and demographics. Identify which job titles, industries, or company sizes actually drive results, then shift budget toward them.
- Set a consistent review cadence. Check spend and CTR daily, engagement and frequency weekly, and ROAS or cost-per-conversion monthly. Reviewing ROAS daily just means reacting to noise.
- Go beyond platform metrics. Cross-reference ad data with your CRM to see which campaigns are actually driving pipeline and closed revenue, not just form fills.
This sequence matters as much as the individual steps. Skip step one, and you'll misjudge a good campaign because you measured it against the wrong goal.
Turning Reporting Into Revenue: Why Expert Analysis Matters
The most common mistake in LinkedIn advertising is optimizing for the wrong metric entirely: chasing impressions or clicks while pipeline stays flat.
Without CRM-connected attribution, most advertisers are left guessing which campaigns deserve more budget and which should be cut. At scale, that guesswork is a coin flip with a bigger price tag.
A structured testing framework changes the outcome. Beyond the Funnel, led by Joshua Stout, one of only 16 LinkedIn Certified Marketing Experts in the U.S., built its approach around a simple idea. Validate audiences with real data before scaling spend, then connect that performance back to pipeline through transparent reporting.
For Evidation, that approach translated into results the client could actually measure. According to Michael Arbini, former Head of Commercial Marketing at Evidation, Beyond the Funnel helped "map out and execute a full LinkedIn strategy" that took the company's pipeline from a few dozen opportunities to over 100 in a single year.
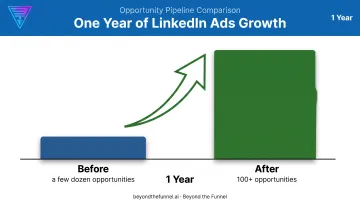
That kind of growth doesn't come from watching CTR climb. It comes from:
- Testing audience segments before committing budget at scale
- Refining creative based on real engagement signals, not guesswork
- Reviewing performance on a consistent cadence, not sporadically
- Tying every campaign back to pipeline outcomes, not just platform metrics
Raw Campaign Manager data can tell you a campaign is running. It takes a full-funnel strategy to tell you whether it's actually working.
Frequently Asked Questions
How do I analyze LinkedIn ads?
Start by setting objectives tied to your funnel stage, then track the metrics that match those goals: awareness, engagement, or conversion. Compare performance over time in Campaign Manager or a connected dashboard, and cross-reference CRM data whenever possible.
What are the statistics for LinkedIn ads?
Benchmarks like CTR, CPC, and CPM vary significantly by industry, ad format, and campaign objective. See the specific figures cited in the Key Metrics section above for current format-level and B2B SaaS benchmarks.
Is LinkedIn analytics free?
Native Campaign Manager reporting is available at no additional cost to advertisers already running campaigns. Deeper attribution, revenue tracking, and CRM-connected analytics typically require third-party tools or integrations.
What is a good CTR for LinkedIn ads?
"Good" depends heavily on ad format and industry. Recent client data shows carousel ads averaging around 0.49% and video ads closer to 0.20%, so compare your results against your specific format rather than a single universal number.
How often should I check my LinkedIn ads reports?
Track spend and CTR daily, engagement and frequency weekly, and ROAS or cost-per-conversion monthly. This cadence keeps you responsive without overreacting to short-term noise.
Can I connect LinkedIn Ads data to my CRM?
Yes. LinkedIn officially supports integrations with Salesforce, HubSpot, and Dynamics 365 through its Conversions API. This connection is essential for measuring true pipeline and revenue impact, not just clicks and leads.