Most marketers can pull a Campaign Manager export in five minutes. Far fewer can say which numbers on that export actually predict pipeline. That gap wastes budget on metrics that look good in a screenshot but mean nothing to revenue.
This guide breaks down which LinkedIn Ads metrics matter at each funnel stage, why last-click attribution shortchanges B2B campaigns, and how to package findings so stakeholders actually act on them. It reflects the same testing and reporting approach used by LinkedIn Certified Marketing Experts managing high-spend B2B accounts.
Key Takeaways
- Impressions and reach mean little without funnel-stage context: track them, but don't lead with them
- CPC and CPM both exist on LinkedIn; the right one depends on your campaign objective, not the platform
- Last-click attribution undercounts LinkedIn's influence on long, multi-touch B2B sales cycles
- Cost per qualified lead beats cost per raw lead for judging real pipeline impact
- How you present metrics (audience-specific, narrative-driven) matters as much as which ones you track
Why Native LinkedIn Reporting Falls Short for B2B Teams
Campaign Manager is a closed ecosystem. It tells you what happened inside LinkedIn but says nothing about what happened after the click. Comparing LinkedIn performance to other channels or CRM outcomes means exporting CSVs and stitching them together by hand, every single reporting cycle.
That isolation creates a bigger problem than annoyance. LinkedIn's default reporting relies on last-click attribution, which misses every touchpoint that influenced a deal without generating the final click. In B2B, where buying committees span several stakeholders and sessions before a form fill, that's a lot of missed credit.
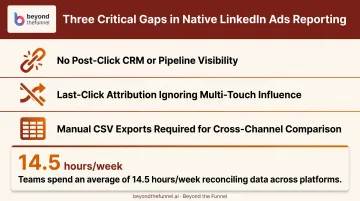
Native LinkedIn reporting leaves three gaps B2B teams feel every cycle:
- No post-click view of CRM or pipeline outcomes
- Last-click attribution that ignores multi-touch influence
- Manual CSV exports to compare LinkedIn with other channels
Manual reconciliation carries a real time cost too. A 2022 Treasure Data survey of 500 senior marketers found teams spend an average of 14.5 hours a week collecting and reconciling customer data across platforms, with 18% spending more than 20 hours weekly.
That study wasn't specific to LinkedIn exports, but the pattern holds: the more channels you piece together by hand, the less time you have to interpret the data. You can't fix a time problem by pulling more reports. Metric selection and presentation strategy beat raw data volume — focus on the few numbers that deserve attention.
LinkedIn Ads Metrics That Actually Matter (By Funnel Stage)
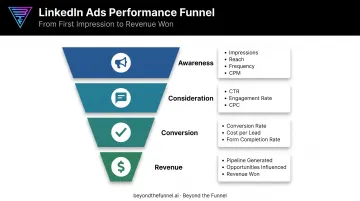
Not every metric deserves equal weight at every stage. Here's what to watch, and when.
Top-of-Funnel (Awareness) Metrics
Impressions, reach, and frequency answer one question: is your ad getting in front of people, and how often?
- Impressions — total times your ad displayed
- Reach — unique accounts that saw it
- Frequency — average number of times each account saw it
LinkedIn's own frequency-cap tool lets advertisers limit delivery to 3 to 30 impressions per member within a seven-day window, according to LinkedIn's Marketing Solutions help center. There's no independently verified universal number where fatigue kicks in.
Still, many teams treat the low end of that range as a gut check. If frequency is climbing past 4-5 within a week and engagement is flat or dropping, refresh creative before assuming the audience itself is wrong.
CPM (cost per 1,000 impressions) is the relevant cost metric here, not CPC. If your objective is brand awareness or reach, judging the campaign by cost-per-click misreads what you actually bought.
Mid-Funnel (Engagement & Consideration) Metrics
CTR and engagement rate (reactions, comments, shares) signal whether your message actually resonates, not just whether it got seen.
Benchmarks vary widely by format and sample. Huble's analysis of 2024 client campaigns found:
| Ad Format | CTR |
|---|---|
| Carousel Ads | 0.49% |
| Single Image Ads | 0.39% |
| Video Ads | 0.20% |
| Follower Ads | 0.04% |
Meanwhile, HockeyStack's B2B SaaS dataset reported aggregate CTR climbing from 0.82% in Q1 to 0.96% in Q3, hitting 1.05% in September. These two figures come from different samples and shouldn't be blended into one "correct" range. Use whichever data source most closely matches your format and industry.
CPC (cost per click) is where the "is LinkedIn CPC or CPM" confusion usually starts. The answer: it's both.
Per LinkedIn's bidding overview, maximum delivery bidding charges by impressions (CPM), while manual bidding can charge by click, impression, engagement, send, or video view depending on the objective you pick in Campaign Manager. CPC isn't a platform-wide constant. It's a setting tied to what you're trying to accomplish.
Bottom-of-Funnel (Conversion) Metrics
Three numbers matter most here:
- Conversion rate — percentage of clicks that complete your desired action
- Cost per lead — total spend divided by leads generated
- Lead form completion rate — percentage of opened forms that get submitted
That third one gets skipped constantly, and it shouldn't. A high CTR paired with a low completion rate usually means friction in the form itself, not a message-market fit problem. Raw CTR won't show you that. Completion rate will.
Beyond that: cost per qualified lead matters more than cost per raw lead. Not every form-fill is sales-ready, and B2B teams that report on raw lead volume alone often end up defending a number that finance doesn't trust.
Precision targeting and audience validation upfront (confirming which roles, industries, and company sizes actually engage before scaling spend) cuts down on the junk leads that inflate cost-per-lead reporting later.
Revenue & Pipeline Metrics
This is where LinkedIn spend earns (or loses) its case with finance and leadership.
- Pipeline generated — value of opportunities created from LinkedIn-influenced leads
- Opportunities influenced — deals where LinkedIn touched the buyer journey
- Revenue won — closed-won revenue tied back to LinkedIn activity
Getting these numbers requires connecting Campaign Manager to your CRM through LinkedIn's Revenue Attribution Report, which syncs with Salesforce, HubSpot, or Microsoft Dynamics.
Setup isn't instant. CRM synchronization can take up to 72 hours, and data may look incomplete while it's still processing. Budget for that lag before you promise leadership a real-time revenue dashboard.
When this connection works, the payoff is real. Beyond the Funnel's work with Evidation is a good example: full-funnel LinkedIn strategy took the company's pipeline from a few dozen opportunities to more than 100 opportunities within a year. That result only shows up once you're tracking pipeline, not just clicks.
Beyond Clicks: Attribution, Pipeline & the Metrics Executives Actually Trust
Here's the scenario that breaks last-click attribution in B2B: a prospect sees five LinkedIn touchpoints over three months, then converts by typing your company name into Google and visiting directly. Last-click gives that final search 100% of the credit. LinkedIn gets zero, despite doing most of the work.
That's not a small edge case. It's the norm for buying committees with multiple stakeholders and research phases stretched across weeks.
Engagement influence is the underused fix. Track accounts that engaged with your ads — viewed, reacted, clicked, but didn't convert immediately — and check whether they show up later in your CRM as opportunities. That "dark" influence often reveals LinkedIn is doing more than Campaign Manager will ever report.
Multi-touch models help distribute credit more fairly:
- Linear — splits credit equally across every touchpoint
- Time-decay — weights credit toward touchpoints closer to conversion
- U-shaped — gives 40% to the first touch, 40% to the last, splits the remaining 20% among the middle
Which model fits depends on your sales cycle. Shorter cycles tolerate time-decay reasonably well. Longer, committee-driven B2B cycles usually get a truer picture from U-shaped or linear models, since they don't undervalue the early touches that got the deal moving in the first place.
None of this matters without one final step: connecting LinkedIn spend data to actual CRM pipeline and revenue. That's the only way to calculate true cost-per-opportunity and return on ad spend. Cost-per-click alone tells you almost nothing about whether the campaign made money.
Metrics executives actually trust look like this:
- Cost per opportunity tied to LinkedIn-influenced pipeline
- Pipeline influenced by engaged accounts, not just form fills
- ROAS on closed revenue, not platform-reported conversions
That full-funnel view is how teams at agencies like Beyond the Funnel move B2B brands from guesswork to predictable growth. When performance stalls, attribution usually shows which variable is broken: audience fit or creative effectiveness.
How to Present LinkedIn Ads Metrics to Stakeholders
Great data, badly presented, still gets ignored. A few rules make the difference.
Match the report to the audience. Executives want pipeline, ROI, and customer acquisition cost. Marketing ops wants CTR, CPC, and creative-level performance. One dashboard rarely satisfies both. Trying to force it usually means neither group gets what they actually need.
Use a green-flag/red-flag structure so people can scan in seconds:
- 🟢 Green: strong cost-per-lead-to-MQL rate → recommend scaling spend
- 🟡 Yellow: CPL rising while lead quality holds → watch creative fatigue and tighten audience
- 🔴 Red: funnel conversion weaker than the previous period → recommend cutting or diagnosing
Build a narrative, not a data dump. Structure every report around three questions:
- What happened?
- Why did it happen?
- What's next?
That structure turns a spreadsheet into a decision-making tool.
Set a tiered cadence:
- Weekly — tactical check-ins for optimization
- Monthly — performance reviews tracking trend direction
- Quarterly — strategic reviews tied to pipeline and revenue outcomes
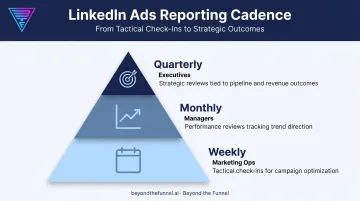
Beyond the Funnel maps this cadence to client tiers so each audience gets the right altitude of detail. Hands-on teams see weekly optimization metrics. Executives get quarterly reviews built around the revenue story, not raw exports.
Annotate context. A budget change, a seasonal dip, or a new audience expansion can make a chart look like a performance problem when it's really just noise. A short note next to the anomaly saves everyone a confusing meeting.
Built this way—and guided by a LinkedIn Certified Marketing Expert when you need the system done for you—reporting stops being a spreadsheet dump and becomes something a board will actually use to decide.
Frequently Asked Questions
Are LinkedIn ads CPC or CPM?
Both. LinkedIn supports CPC (cost per click) and CPM (cost per 1,000 impressions) bidding, and which one applies depends on the campaign objective and bid strategy you select in Campaign Manager, not a fixed platform rule.
What is a good CTR for LinkedIn ads?
Benchmarks vary by format: recent data shows roughly 0.20% to 0.49% for standard sponsored formats, while B2B SaaS accounts often see CTR closer to 0.82% to 1.05%. "Good" depends heavily on your industry and objective.
How do I calculate ROI on LinkedIn Ads spend?
ROI = (revenue attributed to LinkedIn minus ad spend) ÷ ad spend. Accurate ROI needs CRM-connected pipeline data via LinkedIn's Revenue Attribution Report, not Campaign Manager metrics alone.
How often should you report on LinkedIn Ads performance to stakeholders?
Use a tiered cadence: weekly tactical updates for the team managing campaigns, monthly performance reviews for broader stakeholders, and quarterly strategic reviews tied to pipeline and revenue for leadership.
What's the difference between LinkedIn's last-click and multi-touch attribution?
Last-click credits only the final touchpoint before conversion, ignoring everything that came before it. Multi-touch models (linear, time-decay, or U-shaped) distribute credit across all touchpoints in the buyer's journey.
Which LinkedIn Ads metrics matter most for B2B lead generation?
Cost per qualified lead, lead form completion rate, and pipeline influenced matter far more than impressions or raw clicks. Those three connect directly to revenue, not just top-of-funnel activity.