Costs keep climbing. Competition for the same decision-maker audiences keeps intensifying. Benchmarking against 2022 or 2023 data will only lead you astray. This guide breaks down current CTR, CPC, and conversion rate benchmarks by industry and ad format.
The insights here are grounded in analysis from Joshua Stout, founder of Beyond the Funnel and one of just 16 LinkedIn Certified Marketing Experts in the U.S., who has managed performance across 1,000+ LinkedIn ad accounts.
Key Takeaways
- Global sponsored content CTR typically falls between 0.44%-0.65%; anything above 0.6% signals strong performance
- Average CPC sits around $6.50, though it ranges from roughly $4-$15 depending on industry and audience seniority
- Conversion rates vary widely: 3-5% for landing pages versus 6-10%+ for native Lead Gen Forms
- Ad format affects results as much as industry: creative and placement choices can outweigh vertical benchmarks
- Once you have campaign volume of your own, your historical data becomes the most reliable benchmark you have
LinkedIn Ads Benchmarks at a Glance (2026)
Here's the consolidated snapshot most marketers want first. These figures synthesize current data from Ryze's analysis of $47M in ad spend across 874 Campaign Manager campaigns, Dreamdata's 2025 B2B customer dataset, and B2B House's rolling 2026 benchmarks.
| Metric | 2026 Benchmark Range |
|---|---|
| CTR (Sponsored Content) | 0.44%-0.65% |
| CPC | $4.10-$15.20 (average ~$6.50) |
| CPM | $30-$50 |
| CVR (Landing Page) | 3%-5% |
| CVR (Lead Gen Form) | 6%-10% |
| CPL | $68-$200 |
| CPA | No reliable absolute benchmark available |
How CTR Is Calculated (and Why It Varies)
CTR is simply chargeable clicks divided by impressions. The global range for sponsored content sits at 0.44%-0.65%, according to B2B House's rolling 2026 benchmark data. Agency-managed accounts with optimized targeting and creative can push well past that, with some reporting averages closer to 0.89% once testing has matured.
CPC by Seniority Level
CPC isn't flat across audiences. Targeting VPs and Directors typically costs more per click than reaching junior employees, largely because:
- Fewer people hold senior titles, shrinking the available audience pool
- More advertisers compete for that same shrinking pool
- LinkedIn's auction model rewards audience desirability with higher bids
Junior-level targeting tends to generate more clicks at a lower cost, but those clicks often carry less buying authority. That trade-off matters when you're deciding who to target, not just how much to spend.
Landing Page vs. Native Form Conversion Rates
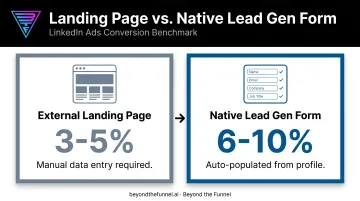
Landing-page CVR runs 3-5%, while Lead Gen Form CVR runs 6-10%, based on Ryze's analysis of 874 B2B campaigns. The gap comes down to friction. A native form pre-fills with LinkedIn profile data; an external landing page asks someone to leave the platform and manually type their information.
Definitions matter here too. Some advertisers count a form submission as a conversion; others only count a marketing-qualified lead. Compare your numbers against the definition, not just the percentage.
Quick Self-Assessment Scorecard
| Metric | Needs Work | Good | Great |
|---|---|---|---|
| CTR | Below 0.44% | 0.44%-0.65% | Above 0.65% |
| CPC | Above $8 | $5-$8 | Below $5 |
| CVR (native form) | Below 6% | 6%-10% | Above 10% |
| CPL | Above $150 | $80-$150 | Below $80 |
Why CPM Runs Higher Than You'd Expect
CPM typically lands between $30-$50. That's steep compared to broad consumer platforms, but it reflects a fundamentally different audience.
LinkedIn's targeting narrows in on verified job titles, seniority, and company attributes. Advertisers pay more per thousand impressions because those impressions land in front of people who actually make purchasing decisions.
LinkedIn Ads Benchmarks by Industry (2026)
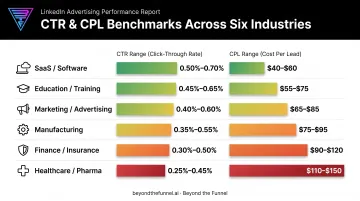
Industry matters, but not in the way most marketers assume. Here's the current breakdown, sourced from Ryze's 18-month, $47M dataset across 874 B2B Campaign Manager campaigns.
| Industry | CTR | CPC | CVR | CPL |
|---|---|---|---|---|
| SaaS/Software | 0.42%-0.65% | $6.20-$11.80 | 6.2%-9.1% | $103-$160 |
| Finance/Insurance | 0.35%-0.52% | $7.80-$15.20 | 4.2%-6.8% | $148-$200 |
| Healthcare/Pharma | 0.38%-0.58% | $6.90-$12.40 | 5.1%-7.2% | $129-$175 |
| Education/Training | 0.61%-0.89% | $4.10-$6.20 | 7.8%-11.2% | $68-$95 |
| Manufacturing | 0.52%-0.78% | $4.80-$7.90 | 6.5%-9.2% | $84-$125 |
| Marketing/Advertising | 0.51%-0.76% | $4.60-$7.40 | 6.8%-9.6% | $82-$120 |
Why SaaS Sees Lower CTR but Higher CPL
SaaS advertisers compete for a narrow band of buyers, often IT leaders or department heads with budget authority. That competition drives CPC and CPL up while CTR stays modest around 0.4%-0.65%. The audience is valuable enough that a higher cost per lead still pencils out against typical SaaS deal sizes.
Why Healthcare and Finance Behave Differently
Healthcare campaigns often land toward the higher end of CTR among these verticals. Compliance-sensitive audiences tend to respond well to niche, highly relevant messaging.
Finance and Insurance show more moderate CTR with some of the highest CPC and CPL figures in the table. That buyer pool is tightly regulated and highly competitive, so costs climb even when click rates stay average.
Why Education Posts the Softest Numbers
Education, by contrast, posts the friendliest benchmarks across the board: lower CPC, lower CPL, and higher CVR. If you're budgeting in this space, use those ranges when you set targets.
Caveat: LinkedIn industry labels are self-reported when a company creates its Page. A B2B House analysis notes this can cause misclassification, so treat these figures as directional, not absolute. Weigh them with audience seniority and offer type: a "high" $150 CPL can still be a bargain against $50,000 annual contracts.
LinkedIn Ads Benchmarks by Ad Format
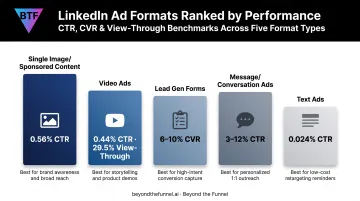
Format choice shifts your numbers just as much as industry does, sometimes more. Here's how the major formats stack up.
| Format | Key Metric | Best Use Case |
|---|---|---|
| Single Image/Sponsored Content | ~0.56% CTR | Default choice for most campaigns |
| Video Ads | ~0.44% CTR (29.5% view-through rate) | Top-of-funnel awareness |
| Lead Gen Forms | 6%–10% CVR | Reducing friction, capturing leads |
| Message/Conversation Ads | 3%–12% CTR (30%–50% open rate) | ABM, event invites |
| Text Ads | Lowest CTR of all formats | Low-cost retargeting only |
Sponsored Content: The Balanced Default
Single image sponsored content delivers the most balanced performance across CTR, CPC, and conversion rate, which is why most advertisers build their core campaigns here first. It's the format LinkedIn's algorithm shows most naturally, and it works across every funnel stage.
Why Lead Gen Forms Win on Conversion
Lead Gen Forms convert at 6–10%, roughly double the 3–5% seen on external landing pages. The mechanics are simple: LinkedIn pre-populates the form with profile data, so someone taps submit instead of typing out their job title and company name on a mobile screen. Fewer steps mean fewer drop-offs.
Message and Conversation Ads for Targeted Plays
Message Ads and Conversation Ads show notably higher CTR and open rates than standard formats. That performance comes with a catch: they work best in tightly targeted scenarios like:
- Account-based marketing campaigns aimed at a defined list of target companies
- Event or webinar invitations sent to a warm or engaged audience
- Re-engagement sequences for prospects already familiar with your brand
Blast them to a cold, broad audience and open rates drop fast.
Video Ads: Awareness, Not Direct Response
Video Ads show lower CTR than sponsored content, but the 29.5% view-through rate tells a different story. People watch, they just don't click as often. Treat video as a brand-building, top-of-funnel tool rather than a lead-gen engine, and pair it with a retargeting sequence to capture interest later.
Text Ads: Handle with Caution
Text Ads carry the lowest CTR of every format on this list, sometimes reported as low as 0.024% when grouped with Dynamic Ads. Reserve this format for cheap brand reinforcement or retargeting a warm audience, never as your primary lead generation vehicle.
Factors That Influence Your LinkedIn Ads Benchmarks
Raw benchmarks only tell part of the story. Three variables shift the numbers more than anything else: audience seniority, region, and funnel stage.
Audience seniority. Junior employees generally click more often but cost less per click than senior decision-makers. Directors and VPs represent a smaller, more contested pool, which pushes CPC upward even as CTR often dips slightly.
Regional variance. Developing markets tend to post higher CTR and lower CPL than mature markets like North America (NAMER). APAC often outperforms NAMER on CTR, with EMEA and LATAM landing somewhere in between. Lower competition in emerging regions plays a large role here.
Funnel stage and objective. Awareness campaigns naturally show lower CTR than consideration or conversion campaigns, simply because the ask is different. You're building recognition, not driving action. Comparing an awareness campaign's CTR directly against a conversion campaign's CTR will always make one look worse than it actually is.
How to Use These Benchmarks to Outperform in 2026
Benchmarks give you a baseline. The real goal is beating your own historical performance through structured testing of audience, creative, and offer.
Here's where most advertisers go wrong: they fixate on CTR alone. A high CTR with a poor CPL or CPA still leaves you short of pipeline. Pair CTR data with CPL and CPA before declaring a campaign a win or a failure.
A full-funnel approach beats chasing a single metric. That means:
- Validate audience assumptions with real data instead of guessing who will engage
- Align creative and messaging to each funnel stage rather than running one ad everywhere
- Connect awareness, consideration, and conversion into a single measurable system
- Optimize continuously, using each campaign cycle to build on what already worked
Beyond the Funnel developed this framework across 1,000+ managed LinkedIn accounts. The same approach helped B2B health-tech company Evidation grow its pipeline from a few dozen opportunities to over 100 in a single year.
Audit your current CTR, CPC, and CVR against the ranges in this guide. If your numbers consistently lag and trial-and-error isn't closing the gap fast enough, partnering with a LinkedIn-certified expert can shortcut months of guesswork.
Frequently Asked Questions
What's a good CTR for LinkedIn ads?
The global average range is 0.44% and 0.65%. Anything above 0.6% is considered strong, while well-optimized, mature campaigns can push toward 0.8-0.9%.
Is 10,000 impressions a lot on LinkedIn?
Not really, especially for tightly targeted B2B campaigns. Don't judge 10,000 impressions in isolation. Audience size, budget, and campaign duration matter far more than the raw number.
What is the 95-5 rule on LinkedIn?
Roughly 95% of your target audience isn't actively in-market to buy at any given moment; only about 5% are. This supports a full-funnel strategy that builds awareness for the 95% while capturing the in-market 5% when they're ready.
What is a good conversion rate for LinkedIn Ads?
Landing page conversion rates typically run 3-5%, while native Lead Gen Form rates run 6-10% or higher. The "right" benchmark depends heavily on your offer and how you define a conversion.
Why are LinkedIn Ads so expensive compared to other platforms?
Higher CPC reflects the value of reaching verified professional decision-makers rather than broad consumers. Judge cost-per-conversion against your average deal size, not against B2C platform pricing.
How much should I budget for LinkedIn Ads in 2026?
Start with enough budget to gather useful performance data, typically a few thousand dollars monthly based on your target CPC and CPL. Use your own results to refine that number as campaigns mature.