Part of the problem is that "good" conversion rate isn't a fixed number. It shifts based on your offer, where prospects sit in your funnel, and your industry's typical sales cycle. A demo request campaign and an eBook download campaign will never post the same numbers, and comparing them directly is a mistake we see constantly.
This guide breaks down what current data actually shows about LinkedIn Ads conversion rates, where the widely-repeated benchmarks come from (and their limits), and a practical framework for improving underperforming campaigns. It's informed by Beyond the Funnel's experience managing more than 1,000 LinkedIn ad accounts.
Key Takeaways
- Conversion rate isn't universal; it depends on how you define "conversion" and which offer you run
- CVR (conversions ÷ clicks) differs from CTR and lead form completion rate; mixing them skews benchmarks
- Audience precision, offer-to-funnel fit, and landing page experience drive CVR more than creative alone
- Sustainable gains come from continuous testing across audience, creative, and offer — not one landing page tweak
What Is LinkedIn Ads Conversion Rate (and How to Calculate It)?
Conversion rate measures the percentage of clicks that result in a completed action you've defined as valuable. That action could be a macro-conversion (a demo request, a purchase, or a sales call booked) or a micro-conversion, like a content download or a newsletter sign-up.
The distinction matters. Micro-conversions ask less of the visitor, so they naturally convert at higher rates. Macro-conversions ask for real commitment, so they convert lower but carry far more pipeline value. Comparing the two head-to-head without acknowledging that difference is one of the fastest ways to misjudge a campaign.
The Formula
The math itself is simple:
(Total Conversions ÷ Total Clicks) × 100 = Conversion Rate
For example: if a campaign generates 250 clicks and 30 of those clicks result in a completed form, purchase, or sign-up, your conversion rate is (30 ÷ 250) × 100 = 12%.
Post-Click vs. Post-View Conversions
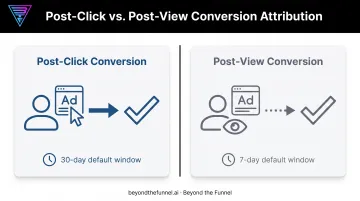
Here's where a lot of advertisers get tripped up in Campaign Manager. LinkedIn tracks two separate conversion types:
- Post-click conversions: The action happens after someone clicks your ad
- Post-view conversions: The action happens after someone sees your ad, even without clicking
Each type uses its own attribution window. LinkedIn's defaults run 30 days for post-click and 7 days for post-view, with options up to 90 or 365 days for certain conversion types.
If your reporting blends both without you realizing it, your displayed conversion rate (CVR) can look inflated compared to what actually happens after a click. Always check which conversion type and window you're viewing before you trust the number.
LinkedIn Ads Conversion Rate Benchmarks: What's Actually "Good"?
This is the question everyone wants a clean answer to, and the honest truth is messier than most blog posts suggest.
You'll see a 2%-5% general range repeated across marketing content, but there isn't a single verified, LinkedIn-published average that backs that figure up.
What does have some grounding: The B2B House's benchmark data puts click-based conversion rates at 5%-15%, and separately reports Lead Gen Form completion around 10%. Meanwhile, MarketingProfs cites a 13% average completion rate for LinkedIn's own Lead Gen Forms.
Notice these numbers don't fully agree with each other. The gaps reflect how "conversion rate" gets defined differently depending on who's measuring it and what denominator they're using.
Why the Conversion Definition Changes Everything
An eBook download will always convert higher than a "Request a Demo" form. Lower friction, lower commitment, higher completion. That's not a targeting problem. It's math. Before comparing your CVR to any benchmark, confirm the benchmark is measuring the same type of action you are.
Industry Variation Is Real, But Rarely Well-Documented
Longer B2B sales cycles and higher-consideration purchases tend to pull conversion rates lower. That pattern holds directionally across healthcare, enterprise software, and financial services.
Be skeptical of any source that hands you a precise industry-by-industry CVR table. Reliable, methodology-backed breakdowns by vertical are genuinely hard to find, and most published figures don't disclose sample size or collection period.
Contextualizing CVR Against Adjacent Metrics
Conversion rate doesn't exist in a vacuum. To find where a campaign is actually leaking, look at the full funnel:
| Metric | Denominator | Rough benchmark |
|---|---|---|
| CTR | Impressions | 0.44%-0.65% (Sponsored Content) |
| Lead Gen Form completion | Form opens | ~10%-13% |
| Conversion rate | Clicks | 5%-15% (click-based) |
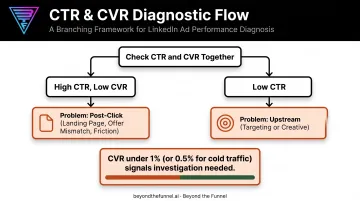
If CTR looks healthy but conversion rate is weak, the problem usually sits post-click: landing page, offer mismatch, or friction. If CTR itself is low, the issue is upstream, in targeting or creative.
A conversion rate consistently under 1% (or under 0.5% for cold, top-of-funnel traffic) is a signal worth investigating. It doesn't automatically mean the campaign is broken, but it's a strong cue to revisit targeting, offer fit, or the landing page before spending more budget.
Is 10,000 Impressions Enough Data to Trust?
Not necessarily. Statistical reliability isn't about impressions alone. It depends on your baseline rate, the size of the effect you're trying to detect, and your desired confidence level.
Statsig's research on statistical power notes that most tests aim for 80% power or higher, and smaller expected effects require larger sample sizes to detect reliably.
For a niche B2B audience with narrow targeting, 10,000 impressions might only generate a handful of clicks and one or two conversions. Drawing conclusions from that is guesswork dressed up as data.
Comparing Your Rate to Industry Averages vs. Your Own Historical Data
Platform benchmarks are a starting point, nothing more. Your own account's trailing 90-day performance, refreshed regularly, is almost always the more reliable yardstick. It accounts for your specific audience, offer, and industry—variables a generic benchmark can't capture.
Why Your LinkedIn Ads Conversion Rate Might Be Falling Short
If your numbers are underwhelming, the cause usually traces back to one of three places.
Broad or imprecise audience targeting. Casting too wide a net dilutes relevance. You might still see a decent CTR from curious professionals who click out of interest. Conversion rate still tanks, because those people were never a real fit for the offer.
Funnel-stage mismatch. Showing a "Request a Demo" offer to a cold audience that's never heard of your brand is asking for commitment before you've earned trust. High-intent offers belong in front of audiences who've already engaged with your content or brand.
Post-click friction. Even a perfectly targeted click can fail to convert if what happens next disappoints:
- Landing page messaging doesn't match what the ad promised
- Forms ask for more fields than the offer justifies
- Mobile load times lag or the layout breaks on smaller screens
Beyond the Funnel's audit process treats underperformance as a foundational issue first, before jumping to creative or budget changes. In practice, the targeting or offer structure usually needs correcting before creative tests or spend increases improve results.
How to Improve Your LinkedIn Ads Conversion Rate
Fixing conversion rate is rarely about a single change. It's a testing discipline applied across four levers.
Before you touch any of them, confirm your LinkedIn Insight Tag is firing correctly and your conversion windows are set on purpose, not left on defaults that may count actions you never meant to track.
Validate audiences with data, not assumptions. Test job function, seniority, and company attributes as separate variables rather than combining them into one broad segment. Let the data, not your best guess about the ideal customer, show which combination actually converts.
Align the offer to the funnel stage. Cold audiences respond better to lower-friction assets: guides, industry reports, benchmark data. Save demos and consultations for warmer audiences you've already retargeted or nurtured.
Strengthen creative and CTAs. Test headlines, formats, and value propositions against each other:
- Single image ads for direct, benefit-led messaging
- Video for demonstrating product or explaining complex offers
- Document ads for gated, high-value content
Optimize the landing page. Match page copy and visuals to what the ad promised. Cut form fields down to what's essential for that offer. Confirm the page loads fast and renders cleanly on mobile, since a large share of LinkedIn traffic arrives from mobile devices.
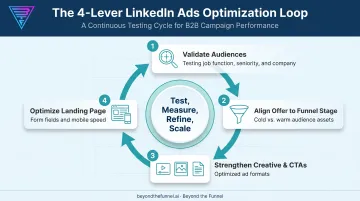
None of this works as a one-time fix. It's a continuous cycle: test, measure, refine, and scale what works.
This is the framework Beyond the Funnel built across more than 1,000 LinkedIn ad accounts: validate the audience first, refine messaging from the data, then scale the combinations that prove out. When Beyond the Funnel applied this approach for Evidation, LinkedIn-driven pipeline grew from a few dozen opportunities to over 100 in a single year.
Tracking & Measuring Conversion Rate the Right Way
How you define and report conversions shapes every benchmark you trust.
Click vs. view conversions change the story. A post-view conversion counts someone who saw your ad and later completed an action, with no click required. Your attribution window (1, 7, 30, or 90 days) can make reported CVR look dramatically different. A 90-day post-click window will always show more conversions than a 7-day window. That does not mean the campaign performed better.
In Campaign Manager, avoid reading Conversion Rate alone. Customize columns so you see it next to the metrics that explain cost and value:
- Cost Per Conversion
- Return on Ad Spend (ROAS)
- Conversion volume (not just rate)
A campaign with a mediocre CVR but a low cost per conversion can still beat a "better" rate that costs more per result.
Benchmark against yourself before you lean on industry averages. Averages are a useful gut-check. Your own historical data, refreshed monthly, shows whether a campaign is truly improving or just swinging with sample size.
Frequently Asked Questions
What is a good conversion rate for LinkedIn ads?
Click-based conversion rates typically fall in the 5%–15% range, while Lead Gen Form completion rates average around 10%–13%. Your right number depends on industry, offer type, and funnel stage.
Is 10,000 impressions a lot on LinkedIn?
Not necessarily. For a niche B2B audience with narrow targeting, 10,000 impressions may only produce a small number of clicks and conversions, too few to draw statistically reliable conclusions about performance.
What counts as a conversion in LinkedIn ads?
Conversions range from macro-actions like demo requests and purchases to micro-actions like content downloads or sign-ups. You define what counts as a conversion when setting up tracking in Campaign Manager.
How is conversion rate different from click-through rate (CTR)?
CTR measures clicks divided by impressions. It tells you how compelling your ad is. Conversion rate measures conversions divided by clicks and shows what happens after someone lands on your page.
Why is my LinkedIn ads conversion rate so low?
The most common culprits are targeting that's too broad, an offer that doesn't match your audience's readiness to convert, and friction on the landing page itself. Start by auditing all three before touching your budget.
How often should I check my LinkedIn ads conversion rate benchmarks?
Review your own account's historical data monthly to catch trends early. Checking industry benchmarks quarterly is enough to stay oriented without overreacting to short-term noise.